The Deepwater GoM Petroleum System: Insights from Piston Coring, Defining Seepage, Anomalies, and Background
Authors
Cole, G.A.1, R. Requejo2, J. DeVay3, A. Yu1, F. Peel1, C.H. Taylor1, J. Brooks4, B. Bernard4, J. Zumberge5, and S. Brown5
1 BHP Petroleum, 1360 Post Oak Blvd., Suite 500, Houston, TX, USA 77056
2 Geochemical Solutions International, Inc., 2203 Timberloch Place Suite 235, The Woodlands, TX, USA 77380
3 Phillips Petroleum Company, 6330 West Loop South, Houston, TX 77401
4 TDI-Brooks International Inc., 1902 Pinon Dr., College Station, TX 77845
5 GeoMark Research Inc., 9748 Whithorn Dr., Houston, TX, USA 77095
Abstract
In the early days of GoM piston coring, locations were chosen on a grid basis, or selected from loose 2D seismic surveys. Such locations resulted in some seepage “hits”, but the majority had either a background signature or an “anomalous” value that was between a true visible seep and background (using fluorescence intensity and UCM content). A scale based on these early data identified anything <5000-10,000 fluorescence units as background, 10000-100000 as anomalies associated with seepage, and >100000 as seepage.
Using new 3D surveys, it is easier to locate seepage-related seabed features. With better defined seepage sites and an extensive geochemical database, the old scale for background versus anomaly versus seepage has changed. By correlating true seepage to reservoired oil, most “anomalies” are not related to seepage or to the reservoired oils, therefore, NOT related to the subsurface petroleum system. The biomarker signatures can be used to define source origins, and when merged with regional understanding of source rocks in the greater GoM basin, a deepwater source model can be derived. 2D TemisPack modeling confirms the seepage results based on a deepwater source rock model placing the primary source centered on the Tithonian with possible secondary source rocks at the MCU and Oxfordian levels.
Based on oil-to-seep correlations, we can demonstrate:
- that most piston cores <30000 fluorescence (300000 new scale) represent background, 30000-50000 (300000-500000 new scale) are low confidence anomalies, 50000-100000 (500000-1000000 new scale) are high confidence anomalies, and >100000 (>1000000 new scale) are truthable seepage.
- biomarker signatures of most piston core extracts with <50000 fluorescence do not correlate to the reservoired oils, however, the number of cores that correlate to seepage varies regionally. Fewer piston core extracts correlate to seepage in the eastern and central GoM, whereas more extracts correlate to seepage in the western GoM in the 30000-50000 fluorescence range. The effects of ROM contamination also differ in other basins, but its effects remain the same, just the thresholds for truthing the extracts are different.
- geographical differences exist.
- a pervasive background biomarker signature is present across the GoM, related to either river discharge sediments containing extractable oil and/or organic matter, or possible sediment de-watering carrying an oil-like signature, unrelated to the subsurface petroleum system.
- there is a distinct pattern related to the Mississippi fan. The “background signatures” appear to contain real oil, but do not correlate to the active true seepage.
Using a rigorous approach when interpreting the detailed geochemical data from the piston cores, the “clean” seepage shows a regional trend that can be used to infer source rock type across the deepwater GoM. In areas where clastic sourcing is prominent, lower sulfur oils are predicted, whereas in areas dominated by carbonate signatures, higher sulfur oils will be present.
Introduction
Surface geochemical exploration techniques have been used to define possible petroleum seepage for the past several decades beginning with basic gas “sniffer” surveys (Jones and Drozd, 1983; Horvitz, 1985) to seabed piston coring surveys used to identify both offshore oil and gas seepage (Brooks et al., 1986; Kennicutt et al., 1987; Sassen et al., 1994). The purpose of these techniques is to determine the presence of near surface hydrocarbon seepage which can then be related back to exploration objectives. In the late 1980s to early 1990s, the use of petroleum seepage was updated and placed in a petroleum system context. Identifying seepage can now be related back to several of the petroleum system elements such as source presence, minimum maturity of the source, and migration of hydrocarbons, especially since most basins are now covered by 2D or 3D seismic grids. These 3 geochemical elements can then be assessed in even greater detail by employing other tools such as 2D and 3D modeling to determine the timing and actual fluid flow of the hydrocarbons within the basin architecture, and in turn, potential structures and traps can be evaluated and risked.
The primary objectives of this paper are:
- to assess the degree to which the piston coring data can be used to classify petroleum seepage as it relates to the subsurface petroleum system in the deepwater Gulf of Mexico (GoM). For most current piston coring vendors, screening data is acquired consisting of Total Scanning Fluorescence (TSF), Gas Chromatography (GC), and headspace gas analysis (as described in Brooks et al., 1986; Abrams and Segall, 2001). For the purpose of this paper, only the TSF and GC data will be discussed as these relate to the “oil-like” compounds, and when anomalous values are encountered, can be further analyzed using biomarkers (saturate and aromatic fractions).
- to correlate the true seepage found in the deepwater GoM to source types for the oils. Then, to invoke a realistic source rock model for the deepwater GoM based on the seepage distribution, and to verify this model using 2D fluid flow models (BEICIP 2D TemisPack).
Discussion
Background versus Seepage in the deepwater GoM
In the past, screening data alone were used to define the presence of background values versus anomalous values versus seepage based on TSF and GC. These values generally ranged from low cut-offs between background and anomalous values and differed from company to company, some being as low as 5000 TSF units for the deepwater GoM and <50 ppm UCM (unresolved complex mixture from GC). Recently, a more rigid classification scheme was suggested by Abrams and Segall (2001) based on the amount of thermogenic high molecular weight hydrocarbons compared to recent organic matter contamination (ROM). These values were considerably higher than those used in the past, about 50000 TSF units and >100ppm UCM. However, this can still be refined even further based on a full assessment of the screening data and the use of saturate and aromatic biomarkers.
For this paper, only the piston coring data from the central and eastern deepwater GoM will be used totaling >2000 locations. Screening data was acquired on 3 sections of each piston core and these data are summarized in Figures 1 and 2. Figure 1 plots the number of samples against maximum fluorescence in each core. The log-log trend between fluorescence and number of samples shows a distinct break at about 50000 TSF units consistent with Abrams and Segall (2001) or indicative of a most likely or high confidence anomaly. At the beginning of the curve, at about 30000 TSF units, these may represent a low confidence anomaly, but anything below 30000 TSF units is considered background. Seepage, especially when used with core descriptions, generally occurs at >100000 TSF units. Figure 2 plots TSF against UCM where most values below 50000 TSF and 150-200ppm UCM form a single large cluster. Therefore, most samples below these thresholds may be background and not indicative of migrating hydrocarbons. The first divergence from this group occurs above the 50000 TSF and 200 ppm UCM thresholds.
To further test the usefulness of these TSF and UCM thresholds, saturate fraction biomarkers were used to define the relative “purity” of the hydrocarbons in the piston core extracts, and as a final exercise, correlated to the subsurface oils in the deepwater GoM. The biomarkers most useful in defining the hydrocarbon characteristics were the hopanes + tricyclics (m/z 191) since reservoired oils will be correlated to seepage. Seepage is generally moderately to severely biodegraded and influenced by even small amounts of recent organic matter (ROM), therefore, the hopanes and tricyclics have been found to be the best biomarkers for these correlations. Because of the biodegradation effects, the gas chromatographic data are not useful for oil-seep correlations. Figure 3 shows examples of the m/z 191 biomarkers considered to be most diagnostic for both the oils and potential seepage. The biomarkers most diagnostic within the oils for source determination are the C24 tetracylic, C21, C23, C24 and C26 tricyclics, C29 norhopane, C29 Ts, C30 diahopane, C30 hopane, 2a-methyl+extended30 norhopane, and the C31-35 extended hopanes. The peaks affected by ROM contamination are also shown. These peaks occur as both individual compounds or co-elute with “oil-like” peaks which greatly influences ROM contaminated interpretations. Additionally, ROM or contamination can contain thermogenic signatures depending upon their origin. Figures 4 and 5 show representative oils and seeps from the deepwater GoM with their respective source origins (carbonate versus clastic influenced) based on the hopanes and tricyclics. Figure 6 shows the differences between clean seepage and variously ROM contaminated piston core extracts. It is readily apparent that the clean seepage can be directly compared to the reservoired oils, whereas the contaminated extracts become less oil-like with increasing contamination. ROM contamination can be assessed using the C31 hopanes, whereby clean seepage has a C31 S/C31 S+R ratio of >0.50, with the reservoired oils in the deepwater GoM having a ratio of >0.55. Figure 7 shows the C31 contamination ratio as a function of fluorescence. Fluorescence values of >100,000 (old GERG scale; 1,000,000 new instrument scale) generally have a C31 S/C31 S+R ratio of>0.5. As fluorescence decreases, this ratio tends to decrease indicating larger contributions of ROM contamination.
What needs to be addressed, however, is how the piston core extracts correlate to the oils and if these data are indicative of low levels of seepage, or are they an artifact of sedimentation processes and other types of contamination. To determine the extracts validity, selected crossplots using the most diagnostic biomarkers for source origins (Peters and Moldowan, 1993) were constructed for extract classes of >0.5, 0.45-0.50, 0.40-0.45, and <0.40 C31 S/C31 S+R ratios and the deepwater oils. These crossplots showed:
- C29 norhopane/C30 hopane versus 2a-methyl+ext.30norhopane/C30 diahopane (Figure 8) this is a crossplot used for source determination as both ratios can be used to determine the clastic or carbonate nature of the source. As both C29 norhopane/C30 hopane and 2a-methyl+ext.30norhopane/C30 diahopane ratios increase in value, the more carbonate the character of the source. As shown in Figure 8 most clean seeps trend with the reservoired oils indicating a single source sequence which changes from a carbonate (highest values) to marl (moderate values) to clastic or clastic-enriched marls) lowest values. These source determinations are important as they can also be used to define the general oil quality, where carbonate derived seeps and oils will have the highest sulfur and metal contents, and the clastic seeps and oils the lowest sulfur and metal contents. The more ROM contaminated piston core extracts plot mostly as a single cluster or trend with some clean seeps. The clustered values suggest that these samples are not a result of seeping hydrocarbons. However, the occasional extracts trending with the clean seeps may have some hydrocarbons associated with them or could be a result of more severe biodegradation. In map view (Figure 9) the clean seeps and oils show a distinctive trend where the greens and olive symbols represent clastic to clastic-marl sourced oils and seeps located primarily in the eastern and northeastern GoM, and the cyan and blue symbols the marl and carbonate derived seeps and oils located in the central GoM. The more contaminated piston core extracts show a more random pattern, indicating that these extracts likely do not represent true seepage of hydrocarbons from the subsurface petroleum system.
- C29 Ts/ C29 norhopane versus C30 diahopane/ C30 hopane (Figure 10) this is a plot used for source determination. As both C29 Ts/ C29 norhopane and C30 diahopane/C30 hopane diahopane ratios increase in value, the more clastic the character of the source. The central GoM seeps and oils are marl to carbonate in origin, whereas the eastern seeps and oils are more clastic in origin. The clean seeps and oils form a single trend ranging from clastic to carbonate. The ROM contaminated extracts form a single cluster and show no regionally consistent pattern across the GoM, again, suggesting these are not related to the subsurface petroleum system.
- C29 norhopane/C30 hopane versus C30 diahopane/C30 hopane (Figure 11) as previously discussed, these two ratios are source dependent. As C29 norhopane/C30 increases, the more carbonate the source of the oil or seep, and as C30 diahopane/C30 hopane increases, the more clastic the source. For the deepwater GoM oils, a single trend characterizes petroleum system across the region. The eastern part of the GoM has a more clastic origin for the oils and seeps, and a more carbonate signature in the central GoM. This suggests a facies change in the source sequence. The ROM contaminated extracts form a single cluster and show no regionally consistent pattern across the GoM, again, suggesting these are not related to the subsurface petroleum system.
- C24 tetracylic/C26 tricyclics versus 2a-methyl+ext.30norhopane/C30 diahopane (Figure 12) this crossplot is used for source determination. As C24 tetracylic/C26 tricyclics and 2a-methyl+ext.30norhopane/C30 diahopane increase, the more carbonate the source origin. Again, the same pattern is observed across the eastern and central GoM. The eastern and northeastern seeps and oils are more clastic derived, whereas the central seeps and oils are more carbonate derived. Interestingly, this plot also clearly shows that the contaminated piston core extracts are not related to the subsurface petroleum system. The clean seeps and oils form a distinctive trend, but the contaminated extracts from the piston cores now show no relationship or clustering to the clean seepage. Their trend cross-cuts the clean seeps and oil trend, clearly illustrating no correlation to the reservoired oils. To better illustrate these two distinctive trends, Figure 13 shows the clastic to carbonate trend for the clean seeps and oils, and Figure 14 for the contaminated seeps.
- C24 tetracylic/C26 tricyclics versus C24 tricylic/C23 tricyclic (Figure 15) this plot shows a distinct trend for the clean seeps and the oils across the central and eastern GoM. The eastern (more clastic) oils and seeps have low C24 tetracylic/C26 tricyclics values and high C24 tricylic/C23 tricyclic values, whereas the central oils and seeps have high C24 tetracylic/C26 tricyclics values and low C24tricylic/C23 tricyclic values. The contaminated piston core extracts clearly plot away from the clean seeps and oils trend indicating no correlation to the petroleum system oils.
One of the questions generally asked when using the C29 Ts and C30 diahopane compounds is their maturity dependency. Figure 16 shows the relationship between fluorescence and TsTm, a known biomarker maturity parameter for similarly sourced oils. This plot shows that most GoM oils and clean seeps have similar maturities regardless of source type and occur over a relatively small maturity window. Because there are no large variations in maturity, it is believed that these compounds may be more source dependent with an underlying maturity dependency, especially for the clastic marls to carbonate oils and seeps from the central and eastern GoM. Also, note that the contaminated piston core extracts do not plot with the clean oils and seeps due to the ROM input. Therefore, no contaminated extracts can be used for relative maturity estimations.
Fluorescence, UCM, and biomarker relationships can be used to determine the validity of the extractable hydrocarbons or hydrocarbon-like material in piston cores. Using biomarkers relationships, it has been shown that only the highest fluorescence and UCM levels contain hydrocarbons that can be directly related to the subsurface reservoired oils or petroleum system. Because of these relationships, most extracts of <50,000 (<500,000 new scale) fluorescence units or <200 UCM are considered background to low level anomalies piston cores. Some piston core extracts in the 50,000-100,000 (500,000-1,000,000 new scale) do correlate to the petroleum system and are classified as high confidence anomalies, but almost all extracts above 100,000 (1,000,000 new scale) do correlate to the petroleum system and are classified as seeps. It are only these seeps that can be used to boost any risks pertaining to charge.
Eastern GoM Case Study
Seepage and its type or origin in the deepwater GoM is controlled by the source rock architecture and the migration of hydrocarbons through the system. The petroleum system responsible for the oil and gas accumulations in the deepwater to ultra-deepwater GoM (GoM) are still poorly understood today in spite of dozens of well penetrations and 1000s of miles of 2D and 3D seismic. Numerous papers have been published on the stratigraphic and structural framework of the northern GoM, but only a few papers have attempted to rigorously apply the petroleum system concepts, due mainly to a poor knowledge of the pre-Tertiary sequence, as it has not been penetrated to date. Therefore, the source rock package in the deepwater GoM remains speculative as to specifics about the source rocks, but a world class source rock sequence is present as proven by >100 seepage anomalies and several deepwater to ultra-deepwater giant to super giant accumulations. However, there are data from the southern GoM and around the rim to suggest adequate source rocks exist, and have or are currently expelling hydrocarbons. The question that arises is, are there different source units across the GoM responsible for these variations in oils and seeps, or are we observing gross facies changes in the source rock sequence basin wide? Therefore a full understanding of the source system and the seepage/oil signatures is necessary to fully evaluate the petroleum system across the GoM.
Source rocks in the greater GoM basin (Figure 17) range from Oxfordian in age (Smackover) to Tithonian (data from southern Mexico and Cuba) to Neocomian (DSDP 535) to Cenomanian-Turonian (Tuscaloosa, Eagleford and Woodbine onshore and from MC84, deepwater GoM) to Paleocene-Eocene (Sparta-Wilcox onshore and in MC84 offshore) to name just a few of the source intervals (Comet et al., 1993). Source rock data are available for most of the source rock sequences around the greater GoM rim, but these are located in both shelfal or shelf-slope or restricted basin settings. Data for the deepwater GoM are sparse, but there are indications of primary source rock development from the Upper Jurassic Tithonian sequence (Garcia and Holguin-Quinones, 1992; Santamaria-Orozco et al., 1994; Clegg et al., 1998; Santamaria-Orozco et al., 1998; Guzman-Vega, M.A. and M.R. Mello, 1999; and Cole et al., 1999; Guzman Vega, 2000; Romero et al., 2000). The Tithonian sequence contains excellent source rock richness and oil-prone quality and can attain up 200m in thickness. Excellent source rocks are characterized by having >4-5% total organic carbon and hydrogen indices >500 mg HC/g TOC. Secondary source rocks belong to the Jurassic Oxfordian and the lower to upper Cretaceous (youngest source occurring around the middle Cretaceous unconformity [MCU], a mappable seismic unit in the subsurface). These source rocks have sufficient source quality to contribute to the petroleum system, but given the architecture of the source sequence, all source rock horizons have overlapping timing of generation and hydrocarbon expulsion and have similar migration routes. Therefore, the petroleum system is a mixed system with most of the hydrocarbons derived from the Tithonian source (Cole et al., 1999; Cole et al., 2000).
Source rocks intervals have been penetrated in the MC84 well in the deepwater (Wagner et al., 1994) and in the DSDP 535 well (Patton et al., 1984; Katz, 1984; Summerhayes, 1984; Herbin et al., 1984). Also, source rock models have been published stating that the oils are derived from either the Mesozoic sequence (Piggott, N. and A. Pulham, 1993; Fiduk, J.C. et al., 1999) or from the Oxfordian, Tithonian, or mixed origins (Wenger, L.M. et al., 1994). For the deepwater GoM, Wenger et al. (1994) published the Exxon view whereby the southernmost oils/seeps of the U.S. GoM was derived from the Oxfordian source, then moving northwards became Tithonian derived, then Lower Cretaceous to MCU derived. Wenger et al. assumed separate source rocks for separate areas across the GoM though no direct evidence suggested this was correct. Piggott and Pulham (1993) published the BP view whereby most of the oils and seeps were derived from a major, single source rock located around the mappable MCU horizon. Since these and subsequent papers in the mid 1990s were published, vast improvements in seismic have allowed us to map the source rock sequences around the east-central GoM. The mappable source rock package is encapsulated between the basement to 30 million year carbonate marker beds, and the most likely source rocks are located between the MCU and basement. As shown by the Tithonian to Neocomian sequence in Cuba (Echevarria-Rodriguez et al., 1991; Campos et al., 1996) and by DSDP 535, most if not all of the mappable source rock sequence contains source rock potential. Source rock properties range from very organic rich, oil-prone condensed marl intervals to fair-moderate organic rich carbonate intervals.
Based on the available data, the most likely primary source rock sequence for the northern GoM is centered on the Tithonian and includes the Neocomian. This sequence is probably thick, about 150 to 200m, and likely has an average TOC of 5% and a 550-700 hydrogen index. Secondary source rock sequences that may contribute hydrocarbons into the system are centered on the Oxfordian (probably 50m net thickness with 2-3% TOC and 450-550 hydrogen index), and centered on the MCU (Turonian level about 50m net thickness with 2-3% TOC and 350-450 hydrogen index). However, based on paleogeographic reconstructions at 160 Ma (Oxfordian), 145 Ma (Tithonian), and 135 Ma (Neocomian), the most favorable time for source rock development would have been during the Tithonian to lower Neocomian. Given the data on the post Neocomian sequence, the Upper Cretaceous probably did not develop any thick, very organic rich intervals due to the more open marine conditions. Figure 18 shows a schematic of the proposed source rock (pod) model for the deepwater GoM. The source sequence is predominantly carbonate to marls across the deepwater GoM and dominated by a thick Tithonian source section. Secondary sources are the Oxfordian and the MCU, but are contributors. As shown previously, the differences and trends in the seepage and oil data are more likely controlled by a change in facies within the source sequence (pod) across the GoM rather than by separate source rocks of different ages.
Regional seepage and oil data (Figure 19) suggest a dominant “marl” type of oil, though some “pods” are more carbonate dominated in the west-central part of the study area, whereas to the east the source pods become more clastic enriched or more dysoxic (versus anoxic) in nature. Modeling shows that no single interval is responsible for charging the seeps and/or accumulations across the deepwater GoM, but over most of the GoM, the timing of expulsion (generally from Neogene to recent across most of the central and east-central GoM) from the basal part of the source pods overlap the upper parts, except along the extreme margins of the GoM where burial was insufficient to mature the entire source pod. However, there is only a single macro-seep outside of the mature zones. The general conclusion is that most of the deepwater GoM oils and seeps consists of a MIXED oil type derived from a mature carbonate to marl source sequence across the GoM, and no single oil or seep can be related to a single source horizon. Does the source sequence change in character from east to west? The answer appears to be yes, as we can define a different “oil” type to the east than we observe in the west, but the mappable source sequence appears to be present, though possibly more clastic at its base. Overall, the seeps and oils observed presently in the deepwater GoM are derived mostly from the Tithonian source with various mixes of Oxfordian and MCU contributions. The source pods appear to be marl dominated in the Green Canyon and Mississippi Canyon and Garden Banks regions, but in southern Walker Ridge and eastwards into Atwater Valley and Lloyd Ridge, the source pods change from marl dominated to marly clastics to clastic dominated. These changes in the source rock character are due to an influx of clastics into the basin during Oxfordian through earliest Neocomian time as the Yucatan platform shed clastics northwards (Peel et al., 2001).
As previously discussed through a series of biomarker fingerprints, crossplots of selected biomarker ratios, and regional distributions of selected biomarker ratios, the regional trends suggest that marl to carbonate derived oils (from a primary source centered at the Tithonian level) are located in the central deepwater GoM, whereas clastic-enriched marl derived oils and seeps characterize the eastern deepwater GoM as well as the southern margin outside of the salt basin (see Figure 19).
When the source origin map (Figure 19) is compared to the regional biomarker distributions discussed previously, it becomes immediately apparent that only a few data points survived the strict criteria used to define a useable data point. The only data that correlated to the subsurface petroleum system were the “clean” extracts generally representing the highest fluorescence/UCM piston cores, and now represent actual seepage. Because such strict criteria were used in this study and because the ROM contaminated extracts could not be correlated to deepwater oils, these were dropped from the regional or sub-regional assessment. This becomes quite apparent for the ROM extracts from the southeastern GoM, and in particular, the Mississippi fan area when compared to the “clean” seeps.
The “clean” seeps and oils in the southeastern GoM are derived from the clastic-enriched marl facies of the Tithonian centered source package, possibly with Oxfordian contributions. The Oxfordian is also likely to be a clastic facies in this part of the GoM based on paleogeographic reconstructions (Peel et al., 2001). The ROM contaminated extracts type to a carbonate or marl source, a direct conflict with the true visible macroseepage found in this area. The question that has to be asked is, “Are these fluorescence anomalies due to hydrocarbon seepage or some other factor?” Selected map views of the biomarker ratios C29norhopane/C30 hopane, C30 diahopane/C30 hopane, and C29 Ts/C29 norhopane, show the distribution of seeps, ROM contaminated cores, and oils in the southeastern GoM (Figures 20-22). Crossplots (Figures 10-14) also show the relationships between the clean seeps and ROM contaminated cores in this region. All of the clean seeps in the study area are derived from a clastic-enriched marl source. The other piston core extracts are either derived from a marl or carbonate source based on a synthesis of >15 biomarker ratios even though single ratios may present the impression that they could be more clastic derived. Of particular note are the piston cores around location “A” on Figure 20. All of these low level anomalies from older classifications (generally <30,000-50,000 fluorescence old scale) have a strong marl to carbonate signature, but the clean seeps with >1,000,000 fluorescence (old scale) have a definite clastic to clastic-enriched marl signature. As shown on a GoM bathymetry map (Figure 23), these piston cores follow the path of the Mississippi fan, therefore, are likely derived from re-deposition of sediments from shelf/slope failure from the north which are depositing a marl-carbonate signature to the south, or alternatively represent a different extractable hydrocarbon signature from the Mississippi River and are not related at all to any GoM petroleum. Regardless, these extracts do not represent the petroleum system active in the eastern to southeastern GoM.
Additionally, the macroseeps in the southeastern GoM can be seen clearly on seismic as illustrated in Figure 24. The macroseep near location “A” on Figure 20 has a fault related migration path above a likely supercharged steep-sided structure to the surface, and correlates to the seep above the salt diapir to the east, but does not correlate to the “anomalies” surrounding the macroseeps. In the east, the anomalies were previously believed to be the result of microseepage. We now know that these anomalies are not related to the subsurface petroleum system since they possess a completely different signature than the macroseeps. This can also be addressed through fluid flow modeling using 2D TemisPack. A cross-section was constructed using the seismic line shown in Figure 24 and this model was run using a full convective and conductive transient heat flow model calibrated to both the regional and well temperatures from wells such as AV471-1 and to the pressures. The primary goal of this modeling was to determine what could seep in the GoM. A series of TemisPack results (Figures 25-28) demonstrate the fluid flow and maturity relationships. Figure 25 shows the percent transformation ratio for the source pod previously discussed, and in this part of the GoM, both the Oxfordian and Tithonian levels are sufficiently mature to expel hydrocarbons. Timing of expulsion overlaps for these two source horizons and occurs from about 5-0 MaBP. Again, this shows the “mixed” nature of the petroleum system since the expelled hydrocarbons from the overlapping sources have essentially the same migration pathways. Migration from the source to traps are shown in Figures 26-28 where migration is primarily vertical throughout the source pod which is dominated by marls, carbonates and some shales. When the first competent sand with regional or sub-regional extent is encountered, migration then becomes primarily lateral and will fill any traps along this pathway. When a structure/trap is encountered, the hydrocarbons will fill the lowest reservoir first and then leak vertically to charge shallower sands due to the buoyancy pressures exceeding the capillary pressures of the seals. As shown in Figures 26-28, the main lateral pathway is mlocated around the Oligocene or early Miocene level and this sand carrier is responsible for charging the structures. Little or no oil flow charges the shallower sands within the basin due to the strong lateral components of migration within the basin. Therefore, the dominant shallow flow is from the water system, and as shown, NO oil leaks to the surface through the Neogene section at this point. No microseepage is occurring, and therefore, no anomalies related to the subsurface petroleum system. These anomalies are the result of non-petroleum system processes. The actual bonafide seepage is modeled in these figures with the only seeps occurring near the shallow salt and above the structures which leak vertically. Fluid flow pathways show hydrocarbons escaping the system only at locations of Seeps A and B, but only water flow where the anomalies occur.
Conclusions
Background levels based on Fluorescence and UCM are now higher than previously established based on biomarker trends from oil to seepage correlations. Values that can be directly tied to oils are most values above 100,000 (1,000,000 new scale) for fluorescence, and >200 UCM. Some values between 30,000 and 100,000 (300,000-1,000,000 new scale) fluorescence are useable, but on a case by case basis.
Fluorescence values that cannot be tied to subsurface oils are likely due to excessive ROM contamination, re-deposition of hydrocarbon bearing sediments from shelf-slope failures, or have been brought in from outside sources (e.g., Mississippi River sediments).
Oil to seepage correlations suggests a regional facies change in the primary source package from west to east across the deepwater GoM. In the west, a carbonate to marl package dominates, and a clastic-enriched marl to the eastern GoM. These correlations are based on the tricyclic and hopane biomarker relationships from m/z191. Seeps were interpreted based on trends identified between the piston core extracts and the reservoired oils using selected biomarker ratios. Key compounds are C23 and C24 tricyclics, C24 tetracyclic, C29 norhopane, C29 Ts, C30 diahopane, C30 hopane, 2a-methyl+ext.30norhopane, and the extended hopanes from the m/z 191 trace, and the C27 diasteranes and regular steranes from the m/z 217 trace.
M/z 217 (not shown) can be diagnostic for the oil types as the more carbonate types contain no to few diasteranes, whereas the marl type contains low to moderate diasteranes, and the clastic type moderate to high diasteranes.
Piston core extracts from non-seep sites (anomalies) can be misleading due to ROM (Recent Organic Matter) contamination, therefore only key compounds should be used to define the source origin. The more ROM contamination in the extracts, the less confidence in the data. Based on the key compounds, ratios were derived to determine the relative source origin of the oils and seeps. The main class of oils in the central deepwater to ultra-deepwater GoM are from moderately sour MARLS, but to the east, there is a “sweetening” of oil types to clastic-enriched marls to clastics.
The oil types around the greater GoM can be typed to variations in the source pods, their respective expulsion and mixing, and can then be related to the overall paleogeography. Assuming a source pod centered on the Tithonian (BHP model), but mixing with contributions from the Oxfordian and Cretaceous (Cenomanian-Turonian), then based on the paleogeography, it is believed the more restricted southern GoM (Mexico) resulted in the deposition of a more anoxic, sour carbonate source, whereas the northern GoM was somewhat more open during the Jurassic and resulted in a less sour, still anoxic marl environment overall except for pockets of more carbonate deposition.
Using piston coring data to address the subsurface petroleum system is a cost efficient method for obtaining geochemical data for understanding the oil types distributed throughout a basin, and if reservoired oils are present, these can be correlated to those oils. The thresholds for determining a valid seep will change throughout a basin, as areas with more recent river discharge or redistributed shelf-slope sediments will likely have more contamination. However, the effects of contamination are almost always present in low level to moderate level samples, but the thresholds for valid samples may differ regionally and from basin to basin. There are always exceptions where some low level cores truth to reservoired oils, but overall most cores with <50000 (500000) fluorescence do not, or their overall validity needs to be addressed. It is strongly suggested that individual companies should do their own investigation and use their own defined thresholds and interpretations when addressing the risk issues associated with the application of piston coring data. The main point is, if the piston core extracts do not correlate to the reservoired oils and therefore the extracts are questionable, how do you apply this data to the migrating hydrocarbons in a petroleum system and address the risks?
References Cited
- Abrams, M.A. and M.P. Segall, 2002, Best practices for detecting, identifying and characterizing near-surface migration of hydrocarbons within marine sediments: OTC, paper 13039.
- Brooks, J.M., C. Kennicutt II, and B.D. Carey, 1986, Offshore surface geochemical exploration: Oil and Gas Journal, p. 66-72.
- Campos, P.G., J.O. Grimalt, L. Berdie, J.O. Lopez-Quinterro, and L.E. Navarrete-Reyes, 1996, Organic geochemistry of Cuban oils I. The northern geological province: Organic Geochemistry, vol. 25, no. 8, p. 475-488.
- Clegg, H., H. Wilkes, T. Oldenburg, D. Santamaria-Orozco, and B. Horsfield, 1998, Influence of maturity on carbazole and benzocarbazole distributions in crude oils and source rocks from Sonda de Campeche, Gulf of Mexico: Organic Geochemistry, vol. 29, no. 1-3, p. 183-194.
- Cole, G.A., R. Requejo, A. Yu, J. DeVay, C. Taylor, P. Dougherty, F. Peel, C. Thomas, D. Ormerod, J. Zumberge, S. Brown, J. Brooks, B. Hoff, and T. White, 1999, The geochemical and basin modeling aspects of the Jurassic to Lower Cretaceous sourced petroleum system, deepwater to ultra-deepwater Gulf of Mexico, offshore Louisiana: 3rd AMGP/AAPG, Veracruz, Mexico, extended abstract.
- Comet, P.A., J.K. Rafalska, and J.M. Brooks, 1993, Steranes and triterpanes as diagnostic tools in mapping of oils, condensates and source rocks of the Gulf of Mexico region: Organic Geochemistry, vol. 20, no. 8, p. 1265-1296.
- Echevarria-Rodriguez, G. Hernandez-Perez, J.O. Lopez-Quintero, J.G. Lopez-Rivera, R. Rodriguez-Hernandez, J.R. Sanchez-Arango, R. Socorro-Trujillo, R. Tenreyro-Perez, and J.L. Yparraguirre-Pena, 1991, Oil and gas exploration in Cuba: Journal of Petroleum Geology, vol. 14, no. 3, p. 259-274.
- Fiduk, J.C,.P. Weimer, B.D. Trudgill, M.G. Rowan, P.E. Gale, R.L. Phair, B.E. Korn, G.R. Roberts, W.T. Gafford, R.S. Lowe, and T.A. Queffelec, 1999, The Perdido Foldbelt, northwestern Gulf of Mexico, Part 2: seismic stratigraphy and petroleum systems: AAPG Bulletin, vol. 83, no. 4, p. 578-612.
- Garcia, R.G. and N. Holguin-Quinones, 1992, Geochemistry tags Upper Jurassic source for most of Mexico’s oil, gas: Oil and Gas Journal, p. 96-97.
- Guzman-Vega, M.A. and M.R. Mello, 1999, Origin of oil in the Sureste basin, Mexico: AAPG Bulletin, vol. 83, no. 7, p. 1068-1095.
- Guzman-Vega, M.A, 2000, Origin of petroleum in the Mexican Gulf Coast basin: GCAGS Transactions, vol. L., p 661.
- Herbin, J.P., G. Deroo, and J. Roucache, 1984, Organic geochemistry of Lower Cretaceous sediments from site 535, leg 77, Florida Straits: Initial Reports of the Deep Sea Drilling Project, 77, Washington D.C. (Government Printing Office), p. 459-475.
- Horvitz, L., 1985, Geochemical exploration for petroleum: Science, vol. 229, p. 812.
- Jones, V. T. and R.J. Drozd, 1983, Predictions of oil and gas potential by near surface geochemistry: AAPG Bulletin, vol. 67, p. 932.
- Katz, B.J., 1984, Source quality and richness of deep sea drilling project site 535 sediments, southeastern Gulf of Mexico: Initial Reports of the Deep Sea Drilling Project, 77, Washington D.C. (Government Printing Office), p. 445-450.
- Kennicutt II, M.C., G.J. Denoux, J.M. Brooks, and W.A. Sandberg, 1987, Hydrocarbons in Mississippi Fan and intraslope basin sediments: Geochimica et Cosmochimica Acta, vol. 51, p. 1457-1466.
- Patton, J.W., P.W. Choquette, G.K. Guennel, A.J. Kaltenback, and A.Moore, 1984, Organic geochemistry and sedimentology of Lower to Mid-Cretaceous deep-sea carbonates, sites 535 and 540, Leg 77: Initial Reports of the Deep Sea Drilling Project, 77, Washington D.C. (Government Printing Office), p.417-443.
- Peel, F., G. Cole, and J. DeVay, 2002, Paleogeographic evolution of the deep-water frontier of the Gulf of Mexico during the Late Jurassic to Cretaceous; a radical reappraisal, and its impact on the petroleum system: AAPG Annual Meeting, Denver, abstract.
- Peters, K.E. and J.M. Moldowan, 1993, The Biomarker Guide – Interpreting Molecular Fossils in Petroleum and Ancient Sediments: Prentice Hall, Englewood Cliffs, NY, 585 pp.
- Piggott, N. and A. Pulham, 1993, Sedimentation rate as the control on hydrocarbon sourcing, generation, and migration in the deepwater Gulf of Mexico: GCSSEPM Foundation 14thAnnual Research Conference, p. 179-191.
- Romero I., M.A., J. Ruiz M., L.M. Medrano M., J. Duran G., R. Rojas R., I. Gutierrez M., and O. Baltazar Ch., 2000, Revitalized Tithonian-Cretaceous petroleum system (!), offshore Campeche, Mexico: GCSGA Transactions, vol. L, p. 663-667
- Santamaria-Orozco , 1994, Organic facies and maturity of Tithonian source rocks from the Sonde de Campeche, Mexico: in extended abstracts, LAOGC.
- Santamaria-Orozco, D., B. Horsfield, R. Di Primio, and D.H. Welte, 1998, Influence of maturity on distributions of benzo- and dibenzothiophenes in Tithonian source rocks and crude oils, Sonde de Campeche, Mexico: Organic Geochemistry, vol. 28, no. 7-8, p. 423-439.
- Sassen, R., I.R. MacDonald, A.G. Requejo, N.L. Guinasso, M.C. Kennicutt II, S.T. Sweet, and J.M. Brooks, 1994, Organic geochemistry of sediments from chemosynthetic communities, Gulf of Mexico slope: Geo-Marine Letters, vol. 14, p. 110-119.
- Summerhayes, C.P. 1984, Organic facies of Cretaceous sediments from deep sea drilling project sites 535 and 540, eastern Gulf of Mexico: Initial Reports of the Deep Sea Drilling Project, 77, Washington D.C. (Government Printing Office), p. 451-457.
- Wagner, B.E., Z. Sofer, and B.L. Claxton, 1994, Source rock in the Lower Tertiary and Cretaceous, Deep-water Gulf of Mexico: Transactions of the GCAGS, vol. XLIV, p. 729-736.
- Wenger, L.M., L.R. Goodoff, O.P. Gross, S.C. Harrison, K.C. Hood, 1994, Northern Gulf of Mexico: an integrated approach to source, maturation, and migration, in Geological Aspects of Petroleum Systems: First AAPG/AMGP Research Conference Proceedings, 6p.
Acknowledgements
We greatly appreciate the permission from BHP Petroleum (Americas) to publish this paper. We are also grateful to the reviewers of the paper.
Figures
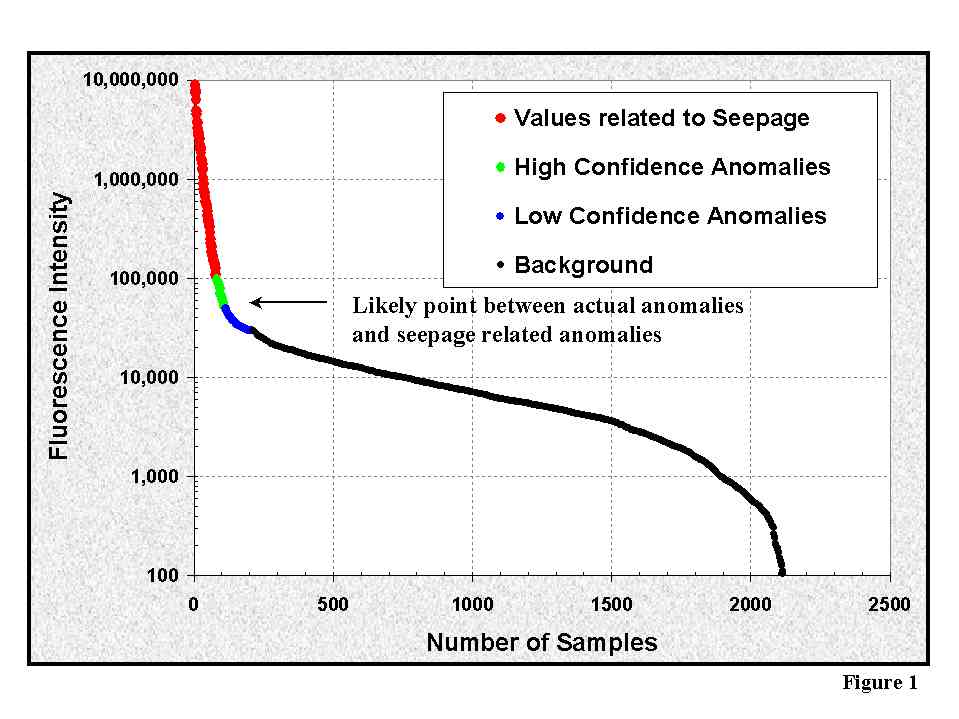
Figure 1
Crossplot of Fluorescence versus number of samples for the eastern and central GoM piston core extracts showing the classification between background, anomalies and seepage. The change from background and low confidence extracts occurs near the marked inflection point of the curve. Most cores above 50,000 fluorescence (500,000 new instrument scale) are classified as high confidence anomalies to true seepage.
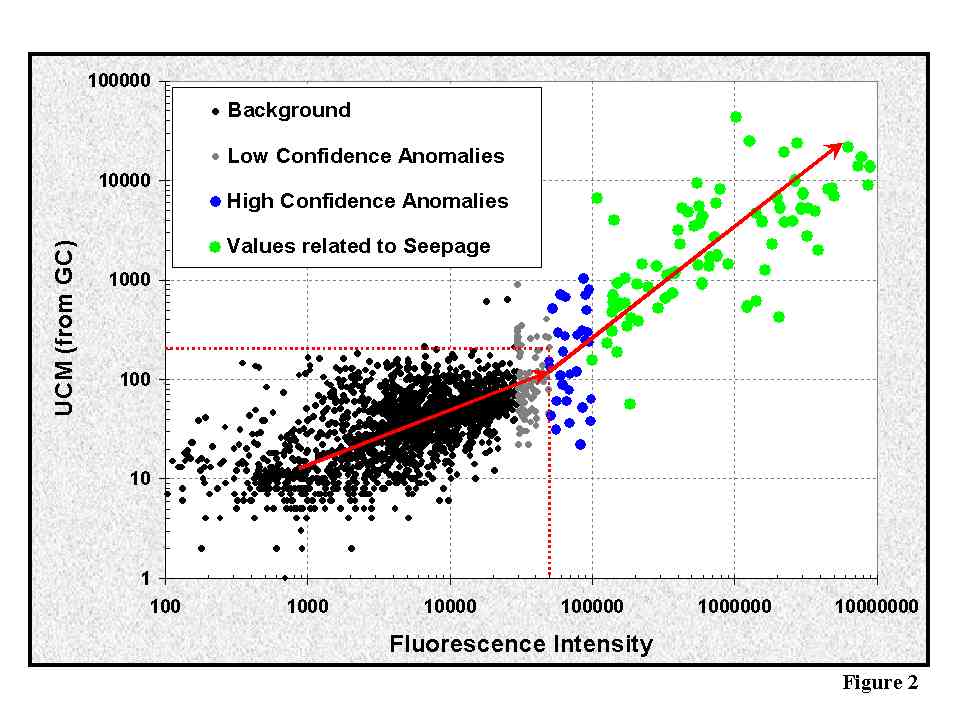
Figure 2
Crossplot of fluorescence versus UCM content from gas chromatography showing the classification of extracts from piston cores in the eastern/central GoM. True seeps typically contain high UCM (>200-500 ppm) and fluorescence (> 100,000 [1,000,000 new instrument scale]).
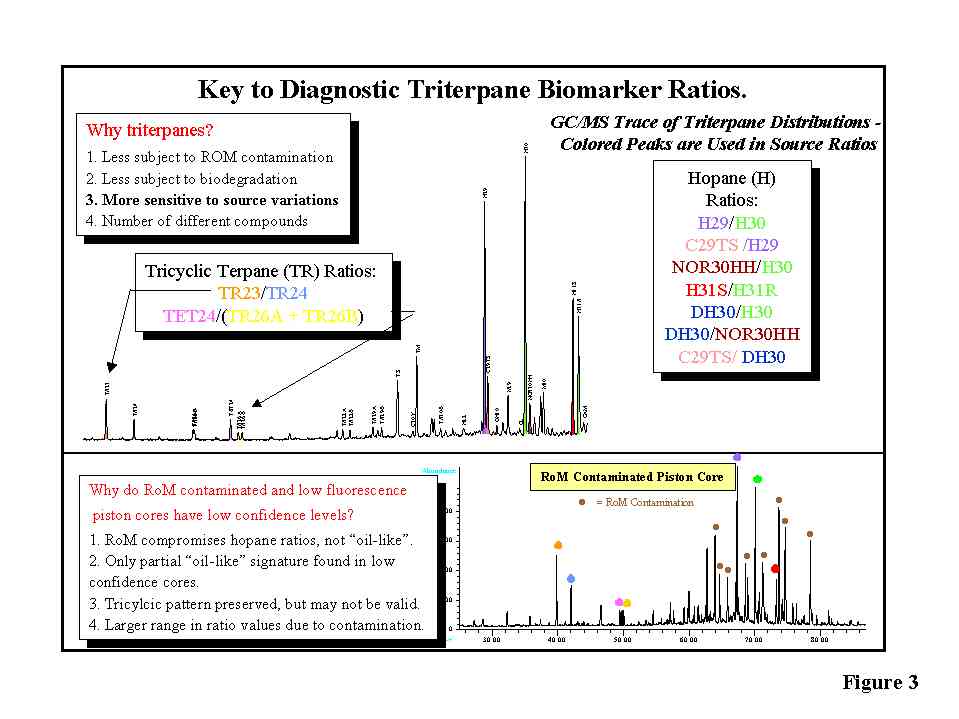
Figure 3
m/z 191 hopane and tricyclic traces showing the key biomarker compounds used to correlate potential seepage to reservoired oils and how recent organic matter (ROM) compromises the distributions of these compounds.
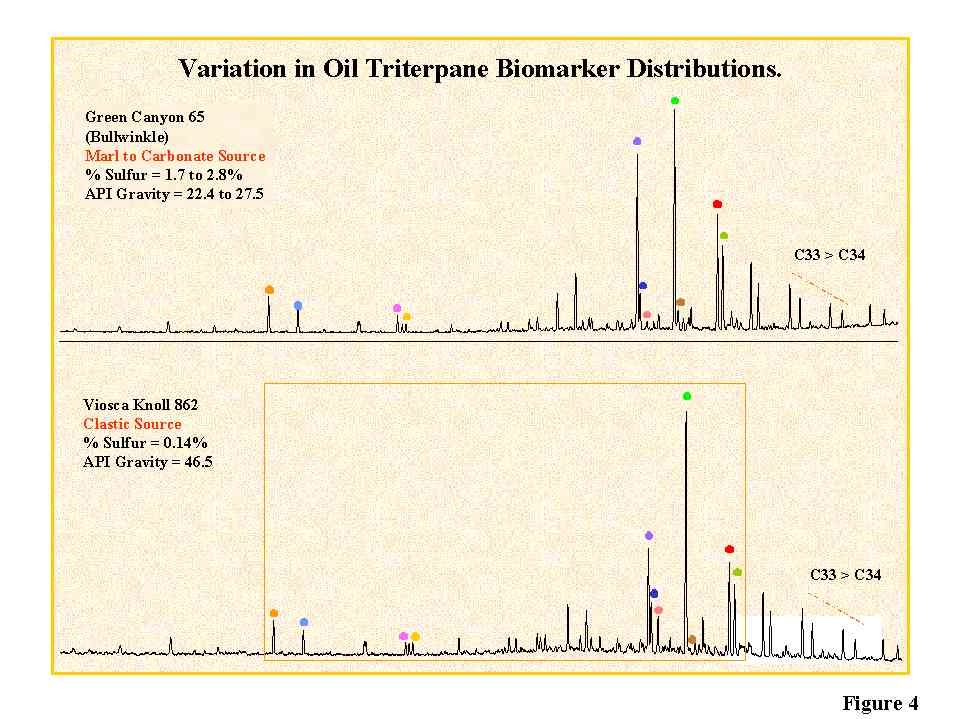
Figure 4
Examples of the m/z 191 hopane and tricyclic traces for reservoired oils in the deepwater GoM. Examples are from the clastic and carbonate/marl derived source types.
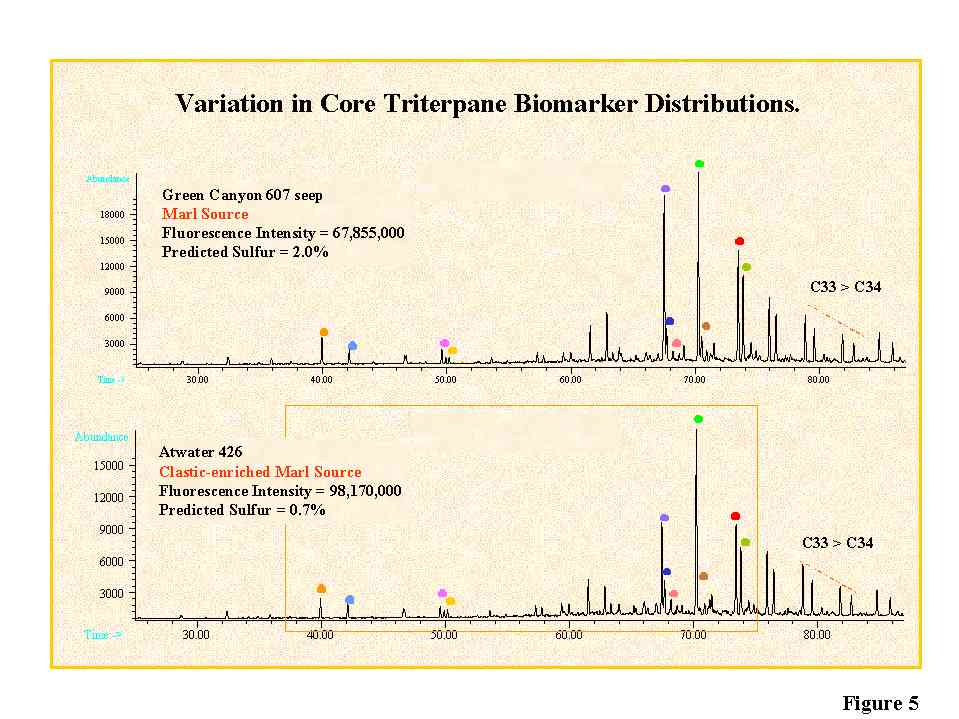
Figure 5
Examples of the m/z 191 hopane and tricyclic traces for piston core extract types representative of clean seepage (no ROM contamination) in the deepwater GoM. Examples shown are of seepage derived from the clastic-enriched marl and marl facies of the primary Jurassic source (Tithonian age).
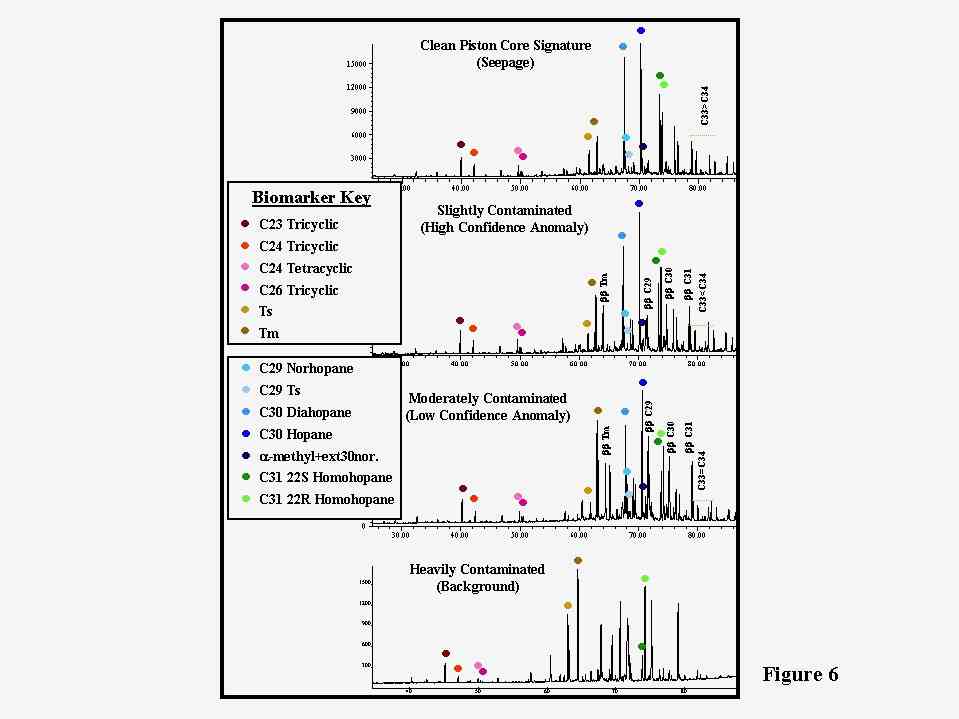
Figure 6
Examples of the m/z 191 hopane and tricyclic traces for the different classes of piston core extracts ranging from heavily ROM contaminated to clean seepage. The differences in biomarker fingerprints and the associated changes in biomarker ratios or relationships are apparent between each extract. Key compounds are identified by the colored circles. Visually, changes can be seen between the clean and ROM contaminated extracts for the C23/C24 tricyclics, C24 tetracyclic/C26 tricyclic, Ts and Tm, and the extended hopanes, in particular the C33 and C34 hopanes. Only the clean seepage correlates to the reservoired oils as will be illustrated in the following figures.
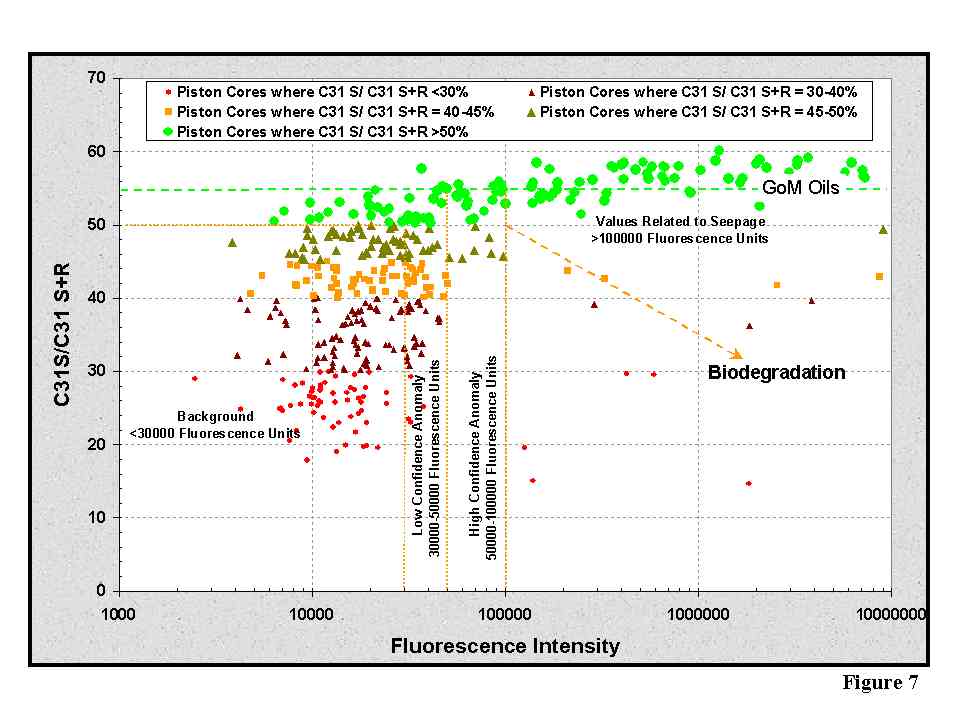
Figure 7
Crossplot between fluorescence and the C31 S/C31 S+R ratio showing that almost all extracts above 100,000 fluorescence (1,000,000 new instrument scale) have similar values to reservoired oils in the deepwater GoM. As fluorescence decreases, the effects of ROM and other contamination compromise the integrity of the biomarker signatures. Below about 50,000 (500,000 new instrument scale), most extracts do not correlate to the oils, but there are occasional exceptions. Greater than 95% of the extracts run for biomarkers have a C31 S/C31 S+R ratio of <0.5, and most of these do not correlate to the reservoired oils. Clean seeps are those seeps with a C31 S/C31 S+R ratio of >0.5, but as this ratio decreases below about 0.55, some subtle differences can be observed in the extract biomarker signatures.

Figure 8
Crossplot between C29 norhopane/C30 hopane and 2a-methyl+extended30 norhopane/C30 diahopane showing that the best correlation and trend occurs between the reservoired oils and the clean seeps. These two ratios are source diagnostic. High values represent carbonate source, and low values a more clastic enriched source, though it is still likely marl in nature across most of the deepwater GoM. Additionally, the majority of extracts with <0.5 C31 S/C31 S+R ratio (slightly to heavily ROM contaminated) cluster in one part of the plot suggesting that these ratios are not indicative of seeping oil, otherwise the data would follow the regional trends. Most of the clastic-enriched marls to clastic shale sourced oils and seeps occur in the eastern and southeastern GoM, whereas the carbonate/marl sourced oils and seeps occur in the central and western GoM (the greater salt basin).
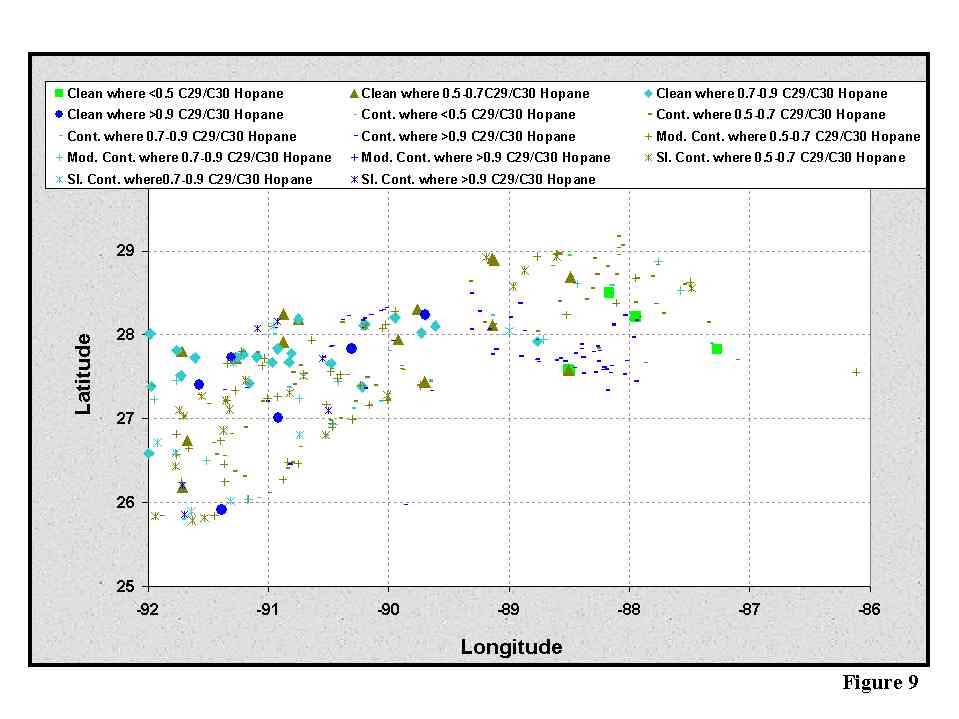
Figure 9
Map showing the distribution of the C29 norhopane/C30 hopane ratio by piston core extract class across the central and eastern GoM. Most extracts do not show a regional trend, however, a trend does occur with only the extracts with >0.5 C31 S/C31 S+R (clean seeps). These extracts or seeps are generally carbonate to marl sourced in the central GoM, and clastic-enriched marl sourced in the eastern GoM. It is believed that these trends are due to a facies change in the primary source, the Tithonian source sequence.

Figure 10
Crossplot between C29 Ts/C29 norhopane and C30 diahopane/C30 hopane showing that the best correlation and trend occurs between the reservoired oils and the clean seeps. The majority of extracts with <0.5 C31 S/C31 S+R ratio (slightly to heavily ROM contaminated) cluster in one part of the plot suggesting that these ratios are not indicative of seeping oil, otherwise the data would follow the regional trends. This plot is also diagnostic for source type as the higher values indicate more clastic input into the source system. For the GoM, the more clastic marls occur in the eastern GoM, and more marls and carbonate sourced oils in the central GoM.

Figure 11
Crossplot between C30 diahopane/C30 hopane and C29 norhopane/C30 hopane showing that the best correlation and trend occurs between the reservoired oils and the clean seeps. The majority of extracts with <0.5 C31 S/C31 S+R ratio (slightly to heavily ROM contaminated) cluster in one part of the plot suggesting that these ratios are not indicative of seeping oil, otherwise the data would follow the regional trends. This plot is also diagnostic for source type as the higher values of C30 diahopane indicate more clastic input into the source system, whereas the higher C29 norhopane/C30 hopane values indicate more carbonate input. For the GoM, the more clastic marls occur in the eastern GoM, and more marls and carbonate sourced oils in the central GoM. A second cluster also appears in this plot and these contaminated extracts are located in the Mississippi Fan area of the GoM (e.g., Atwater Valley). These extracts are anomalous in signature because they suggest a strong carbonate source input, but the clean seeps suggest a clastic-enriched marl to clastic source. When placed in a regional context, these carbonate extracts most likely represent re-deposited carbonate oils from the shelf slope to the north. Also, other biomarkers suggest that these are related to the petroleum system, just displaced by 10s of miles. Aromatic biomarkers such as the aryl-isoprenoids do not occur in these extracts, and also do not occur in any subsurface reservoired oils. Since these extracts may loosely type to a Mars/Europa type source, and since a large majority of the contaminated extracts below a fluorescence of 100,000 (1,000,000) do contain aryl-isoprenoids, it is believed they are displaced. The aryl-isoprene containing extracts do not type to any reservoired oils, and therefore represent either a de-watering effect of the basin which carries this signature within the system, or are from an external source within the sediments being deposited regionally through time.
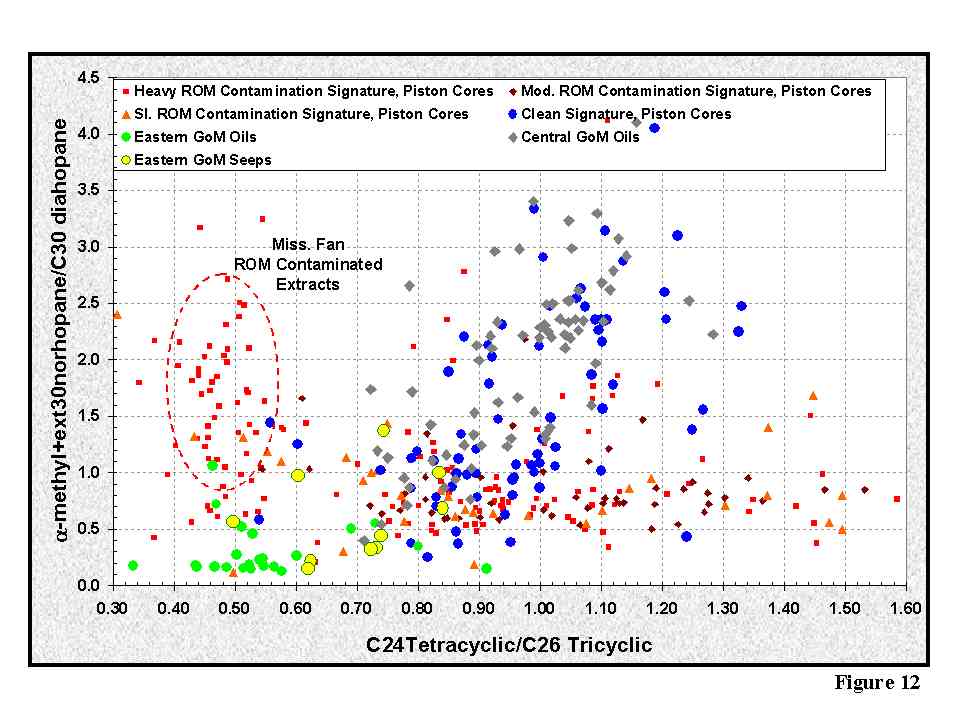
Figure 12
Crossplot between C24 tetracyclic/C26 tricyclic and 2a-methyl+extended30 norhopane/C30 diahopane showing that the best correlation and trend occurs between the reservoired oils and the clean seeps. The majority of extracts with <0.5 C31 S/C31 S+R ratio (slightly to heavily ROM contaminated) plot as a separate trend contrary to the clean seeps and oils suggesting that these ratios are not indicative of seeping oil, otherwise the data would follow the regional trends. Both ratios are also diagnostic of the source system in the deepwater GoM and its regional facies changes. High values of each of the two ratios indicate more carbonate input, low values more clastic input.
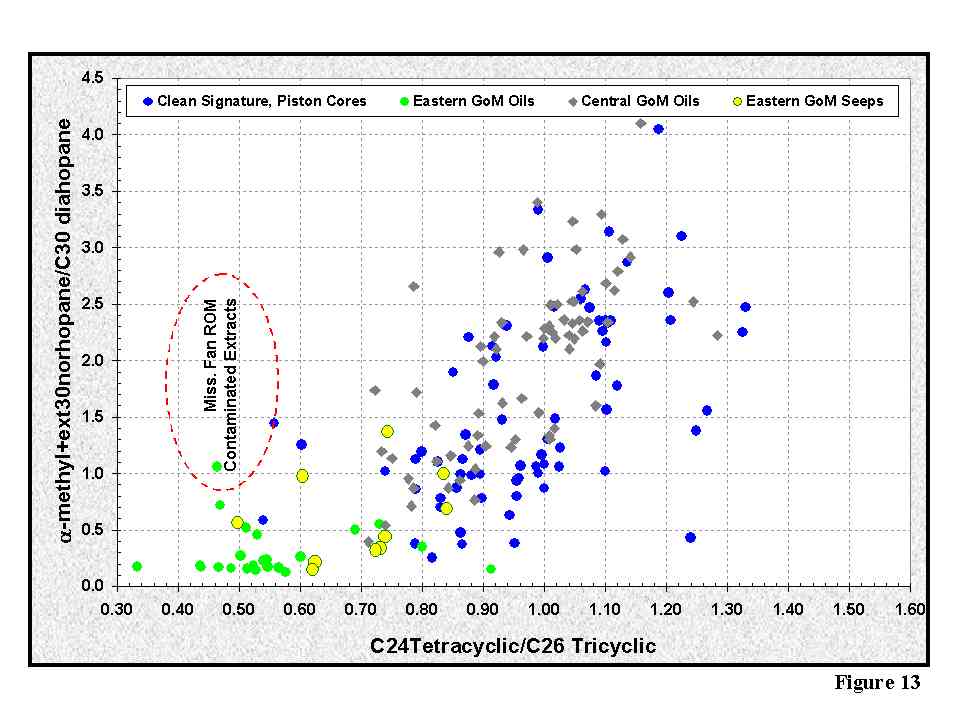
Figure 13
This crossplot shows just the clean seeps and oils from Figure 12, and the well defined trend is obvious.
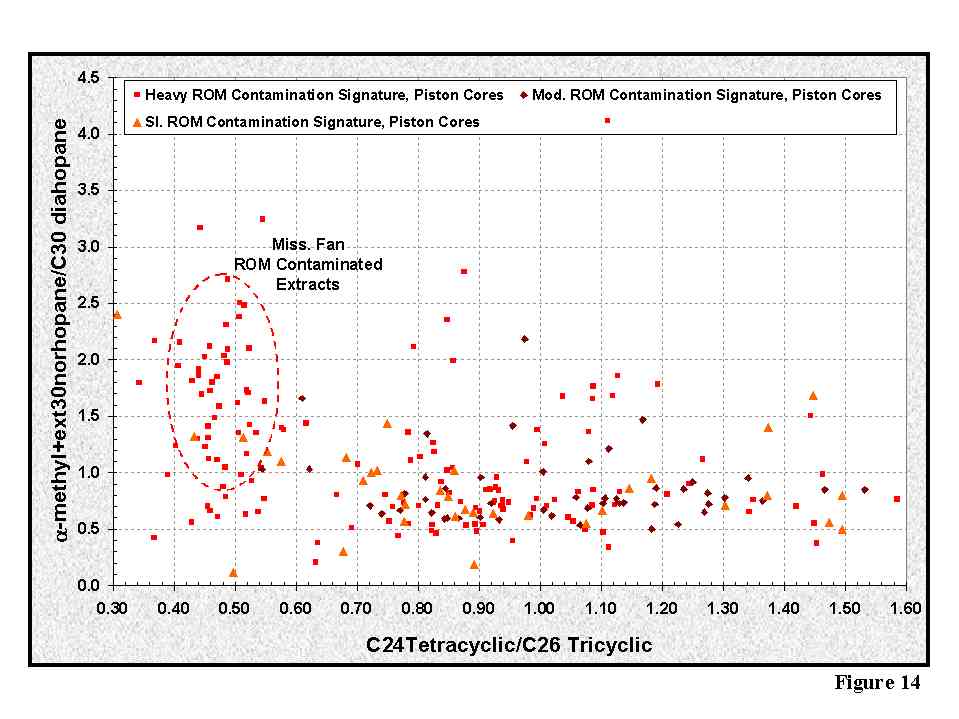
Figure 14
This crossplot shows the contaminated extract trend from the piston cores from Figure 12. When compared to Figure 13, it is readily apparent that the contaminated extracts do not correlate to the reservoired oils. Interestingly, the Mississippi Fan extracts plot as a single group suggesting a different origin from the clean seeps in the same area, however, they do not follow the carbonate trend expected for the areas to the north. This questions the displacement argument from the shelf/slope.
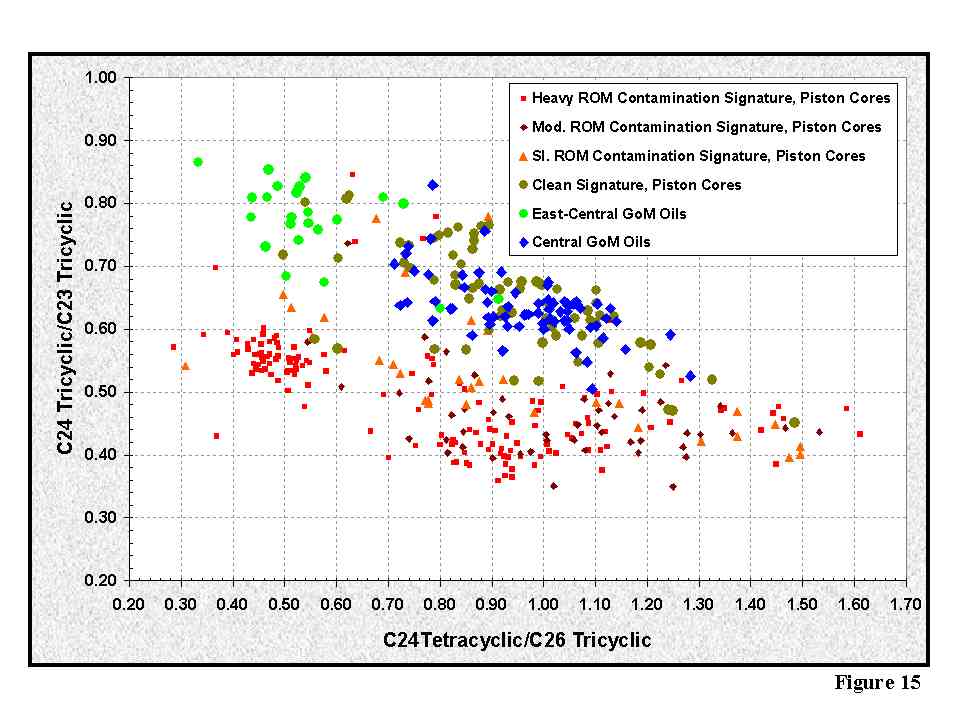
Figure 15
Crossplot between C24 tetracyclic/C26 tricyclic and C24 tricyclic/C23 tricyclic showing that the best correlation and trend occurs between the reservoired oils and the clean seeps. The majority of extracts with <0.5 C31 S/C31 S+R ratio (slightly to heavily ROM contaminated) plot as a separate trend contrary to the clean seeps and oils suggesting that these ratios are not indicative of seeping oil, otherwise the data would follow the regional trends.
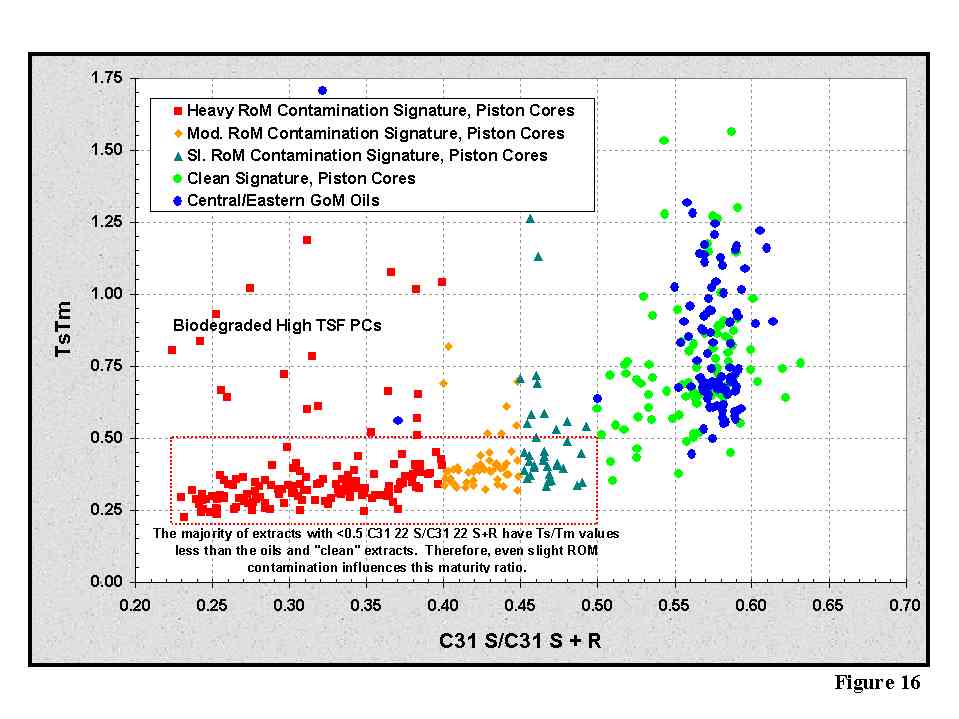
Figure 16
Crossplot between C31 S/C31 S+R ratio and TsTm showing that only the clean seeps and oils correlate. As C31 S/C31 S+R ratio increases, we observe a decrease in TsTm. Since TsTm is a maturity parameter for similarly sourced oils, this relationship between these two ratios suggests that maturity cannot be determined on piston core extracts with even minimal ROM contamination.

Figure 17
Stratigraphic chart showing the source rock occurrences across the grater GoM basin. Most of the Jurassic through Lower Cretaceous source rock occurrences are carbonate or marl source types. This paper now suggests more clastic input into the Jurassic source system (primarily Tithonian age) in the eastern and southeastern GoM and has been tied to paleogeographic reconstructions from Peel et al., 2001.
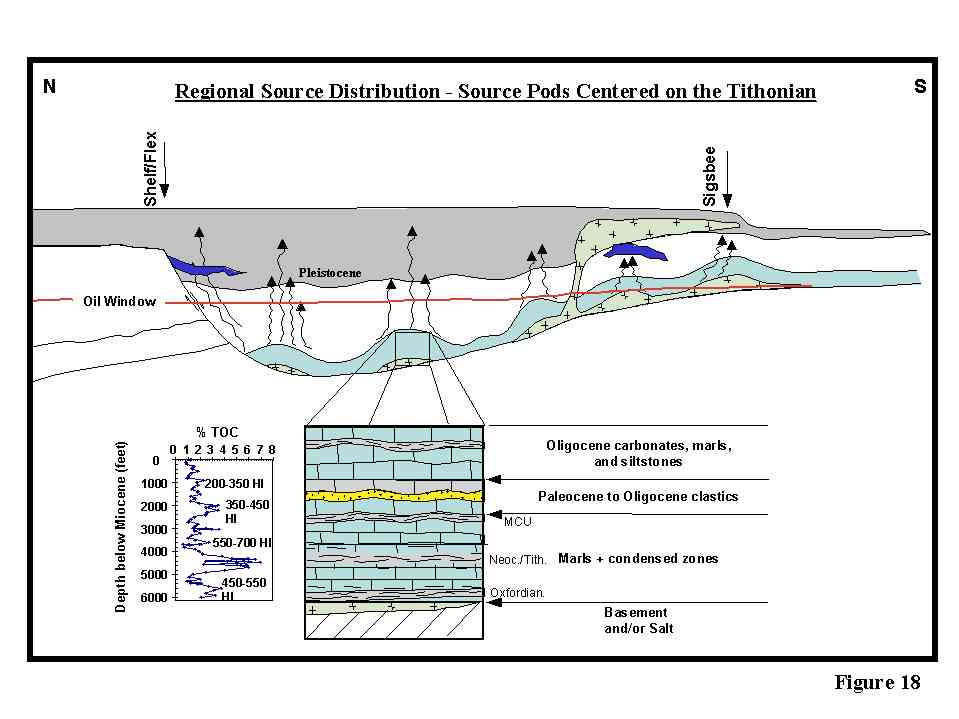
Figure 18
Schematic cross-section from north to south across the central GoM showing the source rock characteristics of the carbonate dominated pods. The primary source rock is the Upper Jurassic Tithonian with 5-6% TOC and 550-700 HI, and secondary source rocks in the Jurassic Oxfordian (3-4% TOC and 450-550 HI) and Lower Cretaceous (at MCU level with 2-3% TOC and 350-450 HI). Thickness of the source sequences is of importance with the thickest source being the Tithonian. The secondary sources at the MCU and Oxfordian levels are relatively thin compared to the Tithonian.
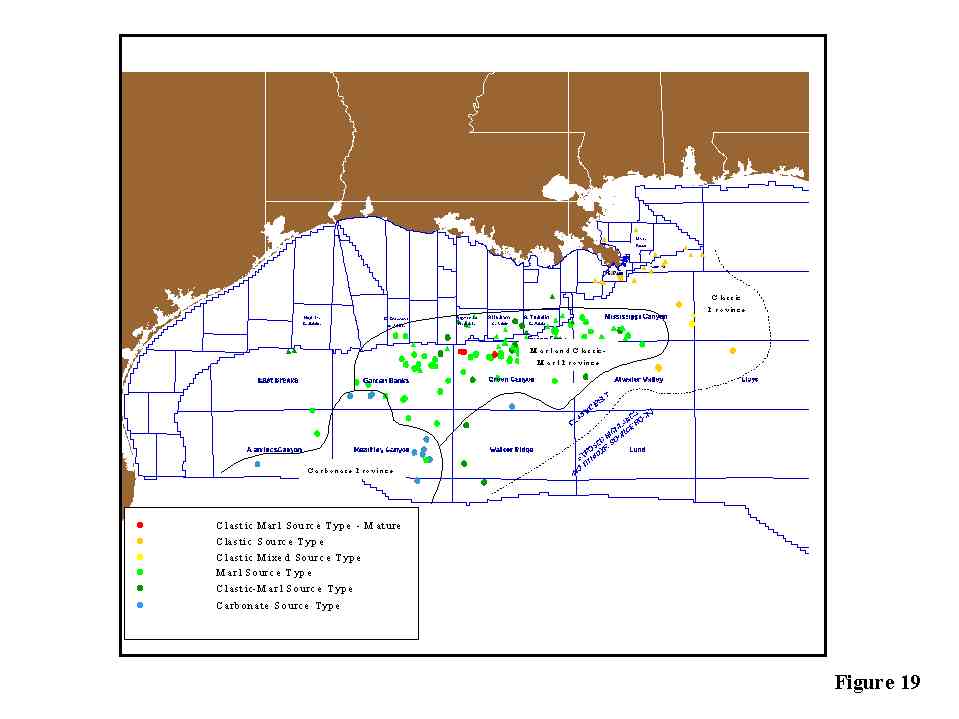
Figure 19
Regional map showing the source type for the seeps and oils across the deepwater GoM. These trends are based on biomarkers profiles using about 20 biomarkers ratios using statistical PCA analysis. Because of this statistical treatment of the data, maps on just one biomarker ratio may not be diagnostic GoM-wide. As shown, the central and western GoM deepwater are dominated by marl and carbonate sourced oils and seeps, whereas the eastern and southeastern GoM is dominated by clastic-enriched to clastic source types indicating a facies change in the source pods.

Figure 20
Map of C29 norhopane/C30 hopane for the Mississippi Fan area of the southeastern GoM. The clean seeps and oils have a clastic-enriched to clastic source type whereas the piston core extracts have a clastic-enriched marl to carbonate signature depending on the particular ratio (see Figures 21 and 22). The edge of the Mississippi Fan sediments is shown by the red dotted line, and the modeled TemisPack line in black.
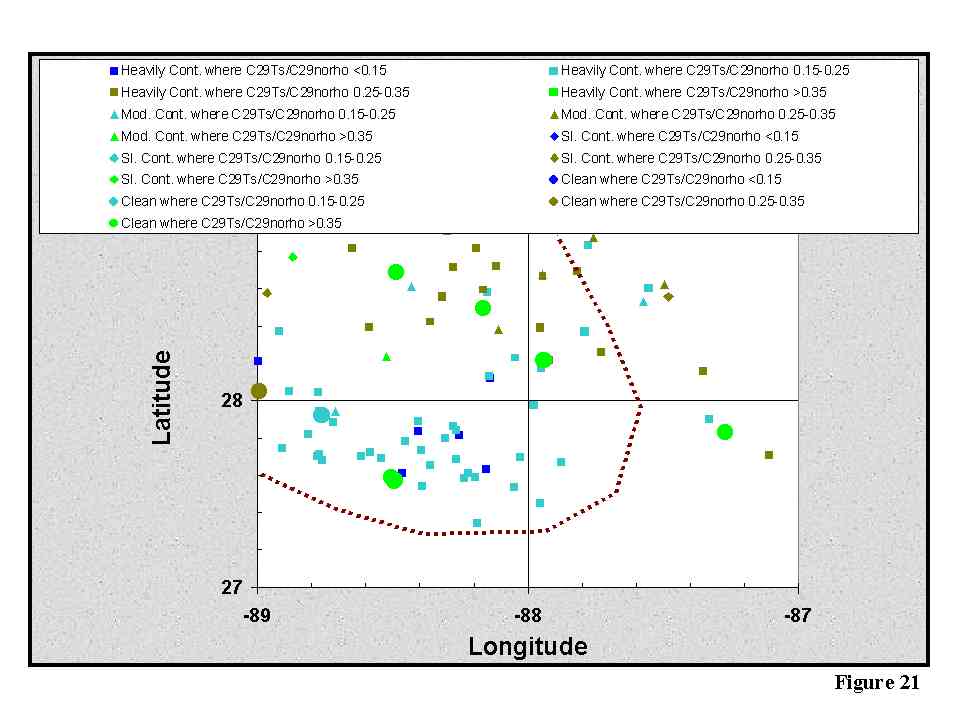
Figure 21
Map of C29 Ts/C29 norhopane for the Mississippi Fan area of the southeastern GoM. The clean seeps and oils have a clastic-enriched to clastic source type whereas the piston core extracts have a clastic-enriched marl to carbonate signature depending on the particular ratio (see Figures 20 and 22).

Figure 22
Map of C30 diahopane/C30 hopane for the Mississippi Fan area of the southeastern GoM. The clean seeps and oils have a clastic-enriched to clastic source type whereas the piston core extracts have a marl to carbonate signature depending on the particular ratio (see Figures 20 and 21). As shown in the 3 figures for the Mississippi Fan area, the clean seeps and oils have a consistent source origin for almost all the ratios, whereas the contaminated extracts are variable. This relationship occurs GoM-wide when comparing the clean extracts to contaminated extracts. Therefore, the validity of most extracts of <0.5 C31 S/C31 S+R must be questioned as to their relationship to the subsurface Tithonian sourced petroleum system. These extracts are likely derived from re-deposited shelf and slope sediments, sediments deposited by the major river systems, or other sources through time.
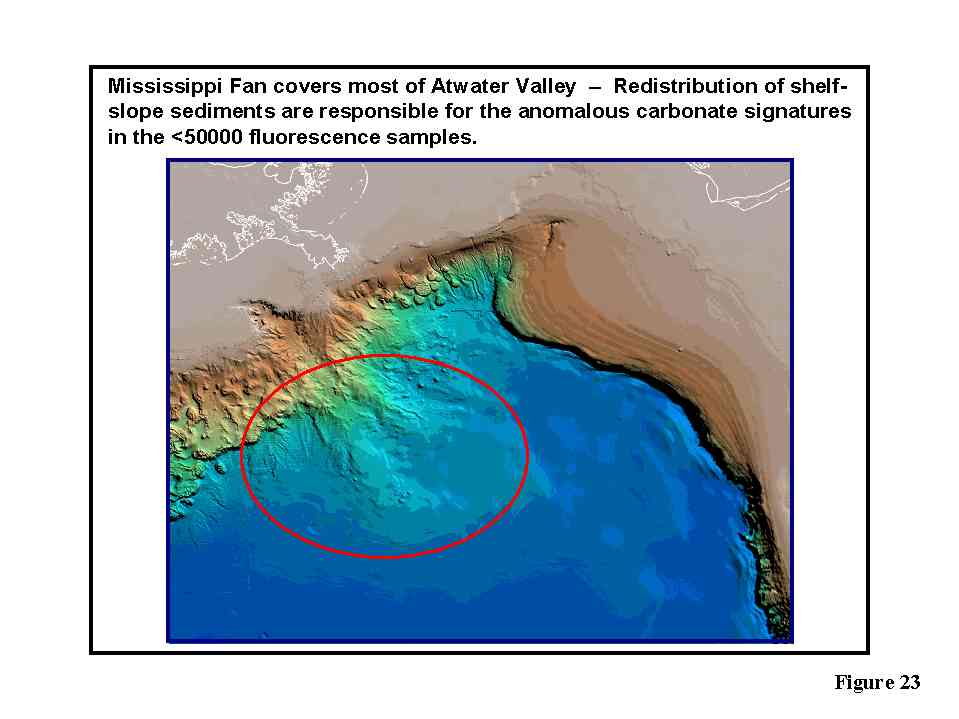
Figure 23
Bathymetry map (from Liu, J. and W. Bryant, 1999, Texas A&M University) showing the Mississippi Fan sediments, some of which are from shelf-slope failures. These shelf-slope failures could be responsible for the more carbonate and marl signatures of some of the piston core extracts from Atwater Valley which do not correlate at all to the clastic-enriched marl to clastic signatures of the macroseeps.
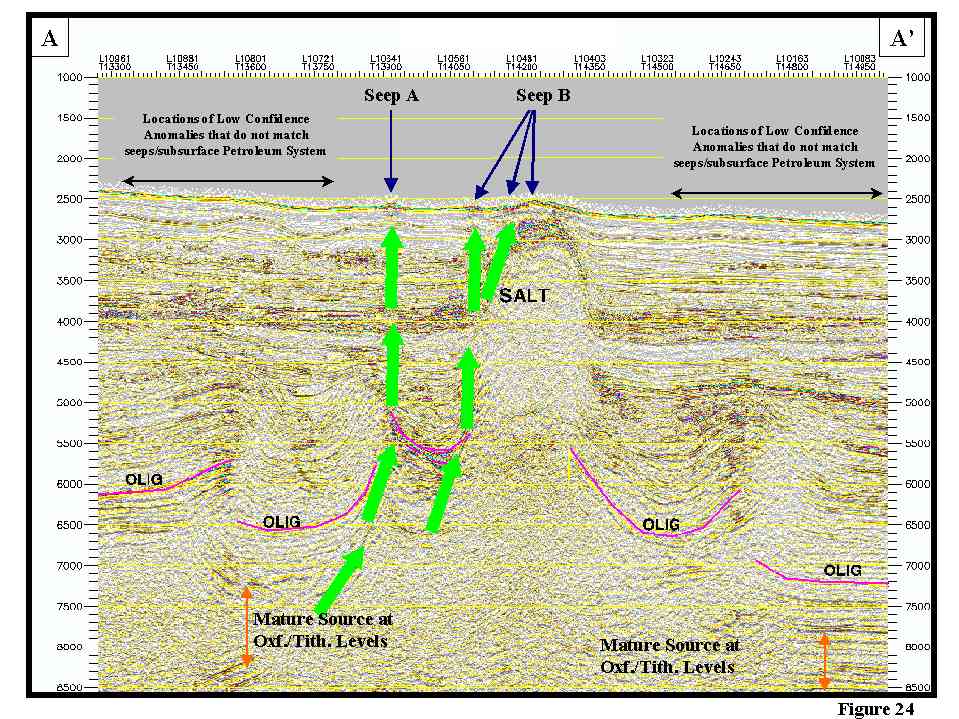
Figure 24
Seismic section used to 2D TemisPack the Mississippi Fan area for migration and charge issues. The clean seeps with clastic-enriched marl to clastic signatures are shown as well as the areas where the carbonate signatures were observed. This line was modeled to determine where oils would migrate to in order to understand the entire plumbing system.
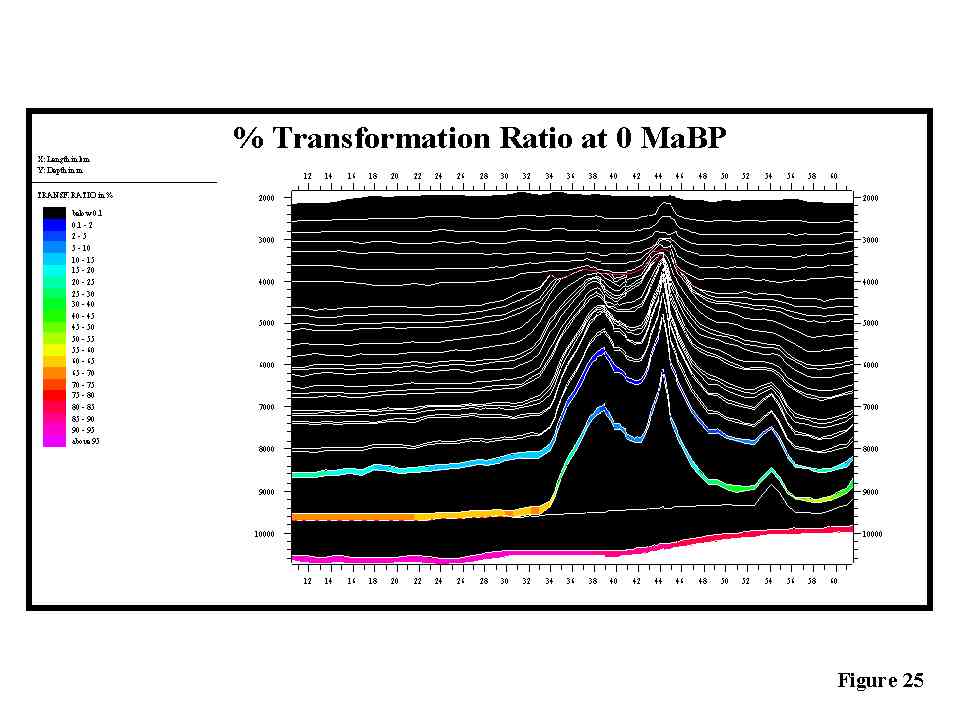
Figure 25
Transformation ratio (%) showing the maturity of the source rocks modeled for the Mississippi Fan area. The primary Tithonian source is at peak expulsion present day, whereas the MCU level source is immature to early mature (no to little expulsion) and the Oxfordian source is post peak expulsion mature. However, both the Oxfordian and Tithonian periods of expulsion overlap and have similar migration pathways, so all contributions are mixed.

Figure 26
Oil saturation at present day for the TemisPack model. Only the structures in the center of the figure are charged, and the saturations are restricted to the source pods and the first primary carrier bed.
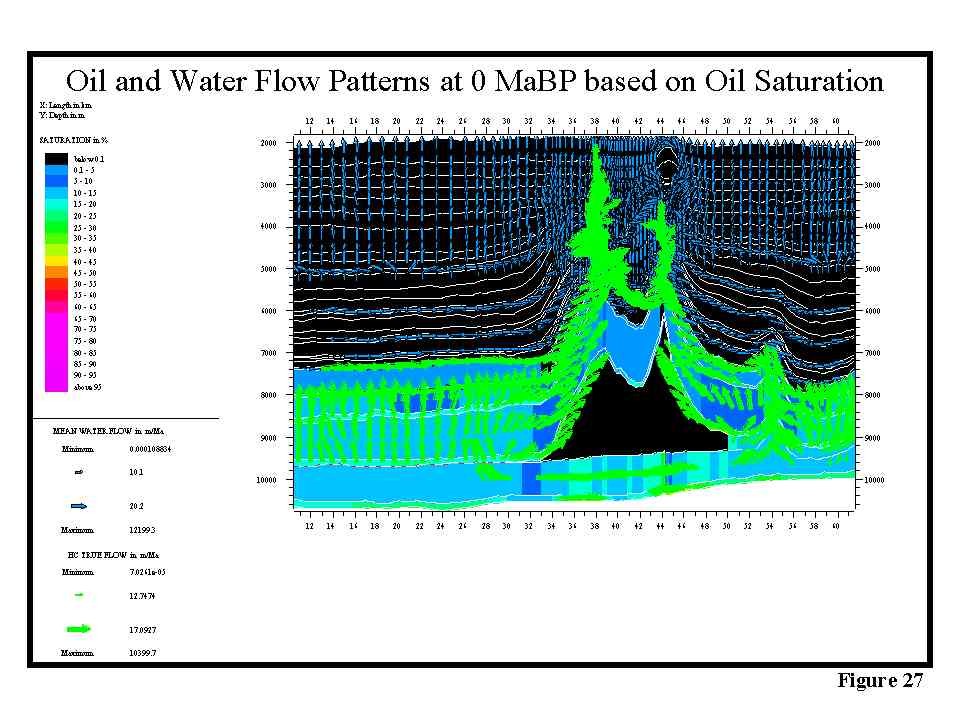
Figure 27
Oil saturations and flow patterns for the TemisPack model show dominantly vertical flow from the source units to the first carrier bed, then vertical flow. Oil flow is shown by the green arrows, and water flow by the blue arrows. The only seeps occur over the structures and are related to either salt-related features or from super charging of a structure where vertical flow dominates due to buoyancy pressures from an oil column exceeding the capillary pressures of the seals. The areas of the carbonate anomalies are dominated by water flow with no associated oil flow. Therefore, these “anomalous” areas are not related to seeping hydrocarbons, but are related to either displaced seepage from the shelf and slope failures or from re-deposition of other sediments (e.g., river sediments). These do not correlate to the subsurface petroleum system in this part of the GoM as the seeps are clastic-enriched to clastic derived.
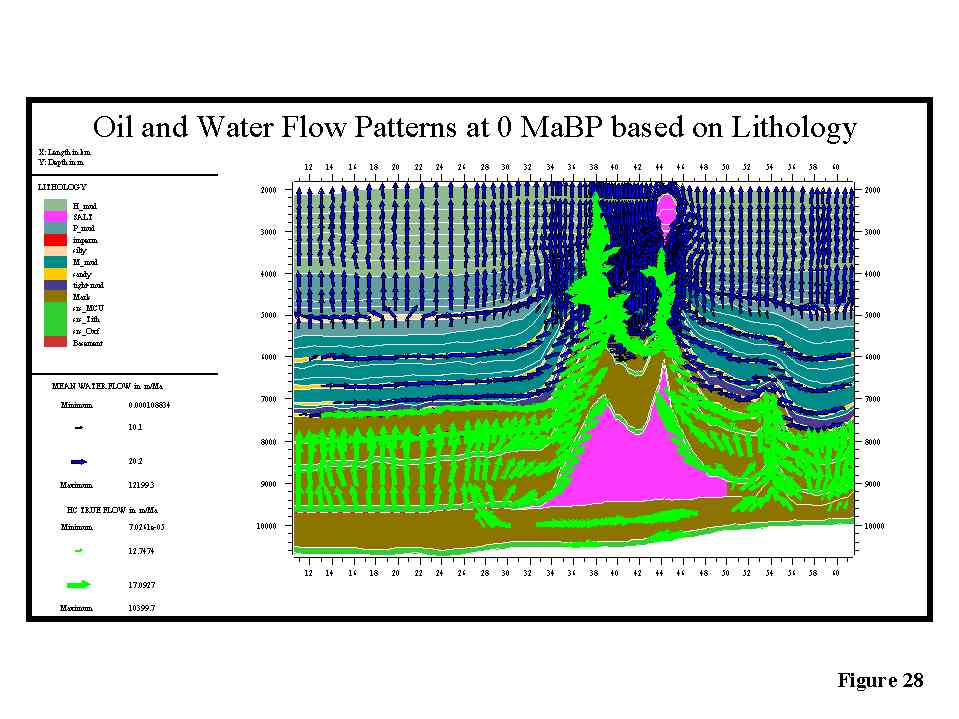
Figure 28
This TemisPack figure shows the water and oil flow patterns as related to the geological section. Oil flow is vertical from the source sequence to the first carrier bed, then lateral flow dominates the upper section. The younger sediments above the first regional carrier do not receive any oil charge, therefore, seepage will not occur where the “anomalous” extracts are located.
Contact Us
TDI-Brooks International, Inc.
14391 S. Dowling Road
College Station, TX 77845
Email: info@tdi-bi.com
Phone: +1 (979) 693-3446
![]()
